False Confidence Metrics Are a Digital Opiate for Operations
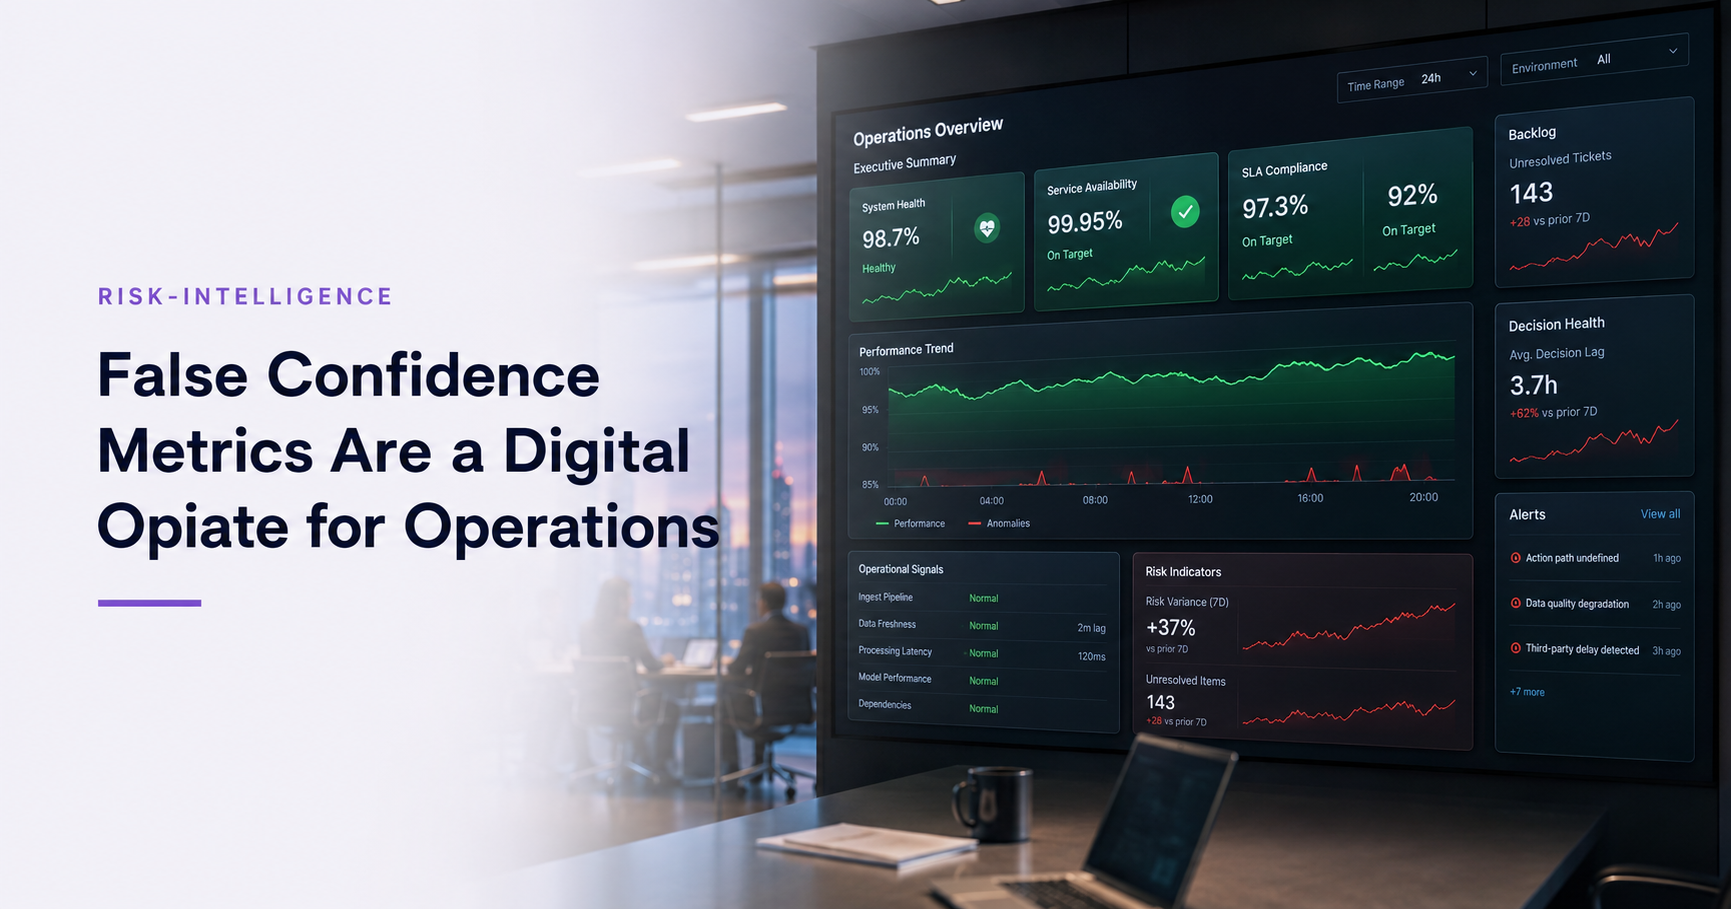
Your dashboard glows green. Everything looks fine. Your boss, and their boss, sees the same green. Problem solved, right? Maybe not. That calm, reassuring hue might just be the digital equivalent of an opiate, numbing you to the real pressure leaks bubbling under the surface.
What Are False Confidence Metrics?
False confidence metrics are data points that present a positive, stable, or acceptable picture of performance, yet fail to capture underlying risks or opportunities that demand action. They explain what happened in a specific, often incomplete way, but offer no real intelligence about what needs to happen next. If a metric doesn’t trigger a pre-defined action or an immediate decision pathway, it’s just decoration, giving you a misleading sense of security.
This isn’t just a BI problem; it’s an operational failure. Reporting is not intelligence. Reporting explains what happened. Intelligence changes what happens next. When your metrics don’t link directly to an operational response, you’re not building intelligence.
The Deadly Calm of Green Indicators
The danger of misleading metrics is subtle. It’s not a glaring red warning that screams “Act now!” Instead, it’s the absence of a warning, the comforting hum of “normal” that prevents any escalation. Think of it like a radar system showing clear skies when a silent, fast-moving threat is already in your airspace. You’re lulled into complacency, burning critical time until the threat is unavoidable.
I’ve seen this countless times in operations: BI teams publish impressive dashboards showing ‘customer satisfaction’ at 92%, yet churn is quietly escalating in a specific segment. Why? The ‘satisfaction’ metric only captured survey responses, not actual customer behavior or the intense competitive pressure in that niche. It created a collective sense of Dashboard Sedation across the leadership team.
If you ignore these subtle signals, you won’t just miss a trend; you’ll face concrete, operational consequences. Decisions slow down. Losses mount. Your organization develops an Escalation Debt because no one is empowered to act on the ‘fine’ metrics that actually indicate trouble. Eventually, a crisis hits, and everyone asks why the dashboards didn’t show it. The truth? They did, but nobody knew what to do with the information.
From Decoration to Decision Tripwires
So, what do you do when your team is addicted to feel-good charts? You re-engineer your metrics to be decision tripwires, not just historical reports. Here’s how:
Weak Teams vs. Strong Operations
| Weak Teams | Strong Operations |
|---|---|
| Measure ‘activity’ (e.g., tickets closed) | Measure ‘outcome’ (e.g., issue resolution rate) |
| Create dashboards that show ‘status’ | Design metrics that trigger a ‘next action’ |
| Focus on average performance | Highlight variance and edge cases |
| Assume good metrics mean good operations | Assume good operations drive good metrics |
Let’s take ‘customer support ticket volume’ as an example. A weak team reports ‘tickets closed daily.’ It’s often green. A strong operations team, however, doesn’t just report ‘tickets closed.’ They set up a tripwire:
- If ‘ticket resolution time for priority 1 issues’ exceeds 4 hours for 3 consecutive hours, an automated alert goes to the incident response team, opening a war room. Action.
- If ‘customer sentiment on closed tickets’ drops below 70% for a specific product line, a senior support manager is notified to review those cases directly and call affected customers. Action.
These aren’t just numbers; they’re commands. This shifts your operational rhythm. According to a recent study by Splunk, 66% of organizations find it challenging to connect data insights to business value and outcomes, highlighting this exact gap between data and action. Splunk, The State of Data Innovation 2023
Are you content watching your operation on a dashboard that says ‘all clear,’ or do you demand a system that forces immediate intervention when the subtle signs of trouble appear? Which side are you on?
If this resonates, I write about this every week. Subscribe to The Second Mind — Join 1,000+ operators who use this intelligence to shorten their signal-to-action time.