Your Metrics Are Being Gamed: Most BI teams and analysts operate under a delusion
Your Metrics Are Being Gamed: Why Most Reporting Is Not Intelligence
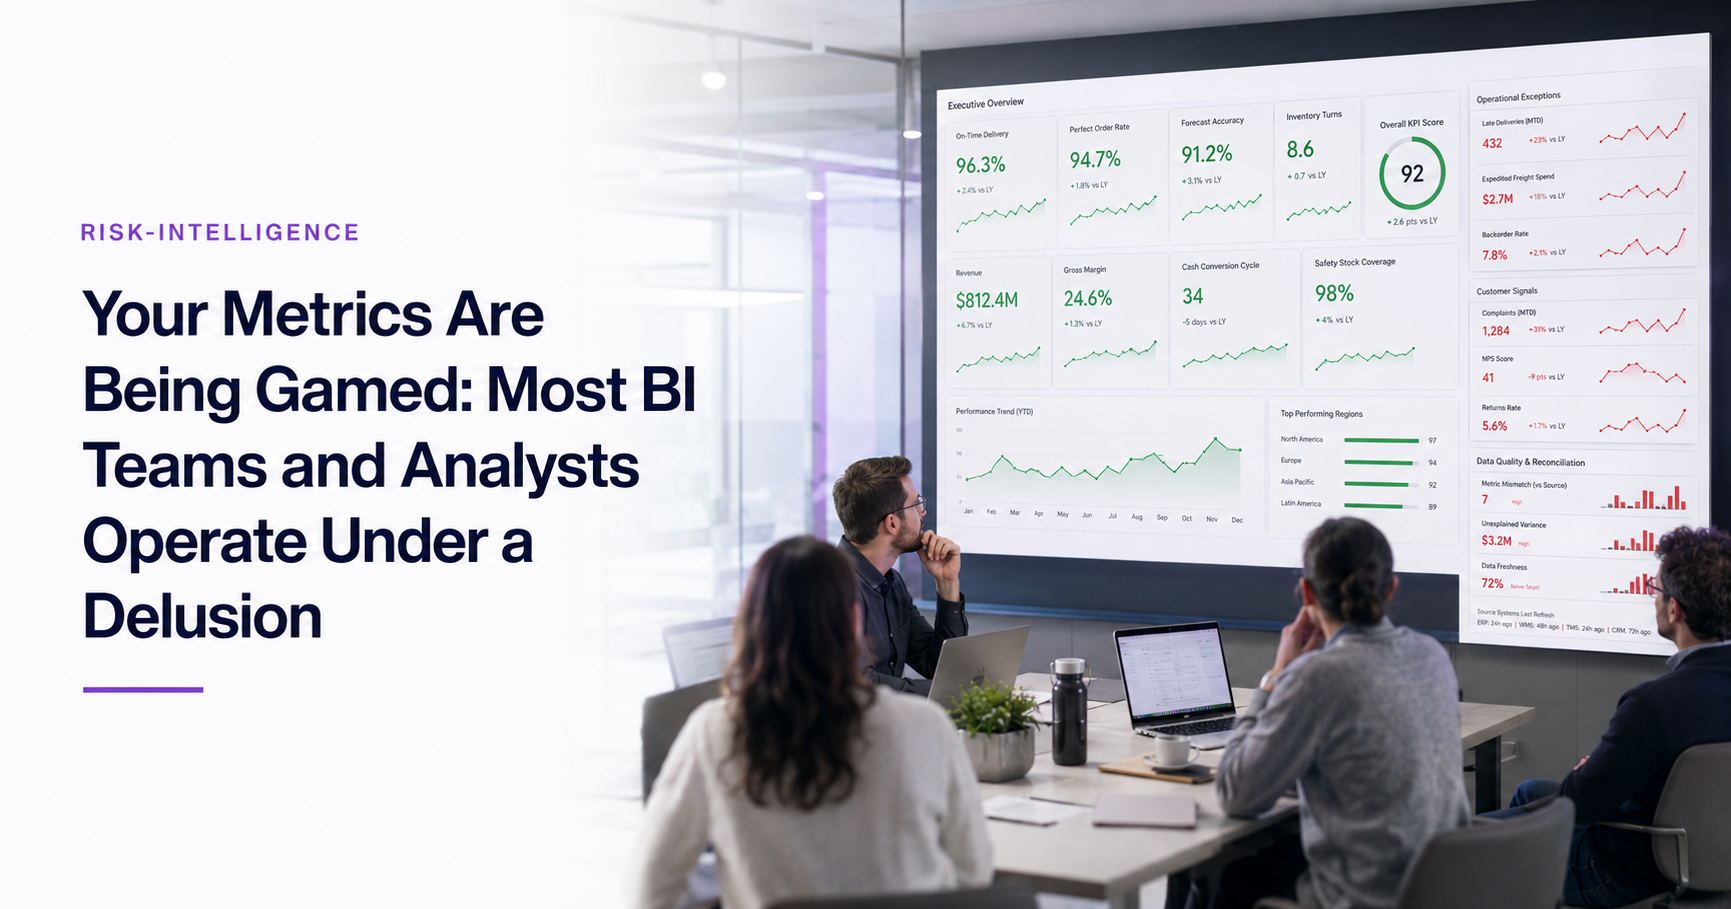
You’re looking at a green dashboard, aren’t you? Everything looks fine. But out in the field, the operation is bleeding. This isn’t an accident. It’s often by design, a direct result of how you’re using — or misusing — metric manipulation.
Reporting explains what happened. Intelligence changes what happens next. If your metrics do not trigger action, they are decoration. They tell you what without telling you where to fight.
The Fiction of Flawless Metrics
Most BI teams and analysts operate under a delusion: that metrics are neutral, objective truths. They aren’t. As soon as a metric is tied to performance, a bonus, or even just visibility, it becomes a target. And targets get gamed. This is classic Goodhart’s Law in action: “When a measure becomes a target, it ceases to be a good measure.” It’s not about malice; it’s about human nature reacting to incentives. You’ve created the incentives, you own the outcome.
I see companies spend millions on fancy dashboards, only to have their operational reality diverge wildly from the pretty charts. This isn’t just a waste of money; it’s a dangerous form of Dashboard Sedation, lulling leadership into a false sense of security while the underlying problems fester. These are not intelligence systems; they’re digital wallpaper.
When Green Means Go to Hell
What happens when you ignore metric manipulation? You get a system that incentivizes bad behavior. Think about the Wells Fargo scandal. Employees, pressured to meet aggressive sales targets, created millions of fake customer accounts. The metric was hit, the dashboard glowed green, but the bank was committing fraud on an industrial scale.
You get operations that optimize for the chart, not the customer.
- Weak teams: Obsess over hitting the reported number. They hide issues, adjust definitions, or push problems to other departments to keep their metrics “clean.” Their dashboards are always green, but their balance sheets are red. They’re decorating, not acting.
- Strong teams: Treat metrics as tripwires. They design them to expose friction, flag anomalies, and force decisions. They expect red, because red means a problem has surfaced and can be addressed. Their focus is on the action the metric triggers, not the metric itself.
If your “on-time delivery” metric is always 98%, but customer complaints about late shipments are rising, you’re either blind or complicit. Someone’s gaming metrics, and you’re letting them.
Actionable Intelligence: From Reporting to Radar
So, how do you stop gaming metrics and turn reporting into intelligence? You have to design for action from the ground up. This means building decision frameworks into your metric design.
Recommendation: For every key metric, define the “if this, then that” action path. Don’t just report the number; report the thresholds that demand a specific operational response, and assign the authority to act.
Consider “Apex Logistics,” a fictional delivery company. Their old metric was “On-Time Delivery Rate,” reported weekly. It looked great. But customers were furious about missed delivery windows. Why? Drivers, incentivized by the rate, were logging deliveries as “on-time” even if they dropped the package at the wrong house or an unsecured location, then circled back later. The dashboard was green. The customers were gone.
Apex re-designed their metrics as a radar system:
- Metric: “Actual vs. Reported Delivery Time Discrepancy”
- Trigger: If (Actual Delivery Time - Reported Delivery Time) > 15 minutes for >5% of a driver’s routes in a day.
- Action: System flags driver, routes for review, supervisor notified, immediate “Why was this?” audit.
- Metric: “Customer Complaint % for On-Time Deliveries”
- Trigger: If Customer Complaint % > 1% AND On-Time Delivery Rate > 95% (a counter-intuitive flag).
- Action: Automated alert to operations manager, a deep dive into those specific “on-time” deliveries, and a review of the underlying reporting mechanism. This signals potential Reporting vs Intelligence Framework breakdown.
This approach transforms a passive number into an active signal demanding a decision. It forces accountability. It means managers don’t just see a number; they see a problem with a pre-wired response.
Make the Hard Choice
Are your dashboards a sophisticated radar system, helping you navigate digital battlefields and spot threats before they hit? Or are they just pretty lights, designed to make you feel good until the inevitable crash?
If this resonates, I write about this every week. Subscribe to The Second Mind — Join 1,000+ operators who use this intelligence to shorten their signal-to-action time.
For a 6-step playbook to kill metrics nobody acts on, read Kill Metrics That Don’t Change Decisions. And for the full thesis on why reporting is not intelligence, see Risk Intelligence.