In early 2024, Google faced a fascinating internal challenge: a sharp decline in employee morale and satisfaction despite strong financial performance. During an all-hands meeting, employees raised concerns about the lack of pay raises and ongoing cost-cutting measures. CEO Sundar Pichai and CFO Ruth Porat were confronted with tough questions about the disconnect between leadership and workforce sentiment. While lagging indicators like financial metrics showed a thriving business, leading indicators such as employee satisfaction surveys and participation in internal initiatives could have flagged the issue much earlier. (Source)
This real-life scenario highlights the importance of understanding leading and lagging indicators. Whether it’s managing employee satisfaction or preventing losses, relying solely on lagging metrics often means reacting to problems after they’ve escalated. By incorporating leading indicators, businesses can act proactively, making informed decisions to address issues before they impact the bottom line.
As someone who has spent years in data analytics and risk management, I’ve seen firsthand how these metrics can transform outcomes when applied thoughtfully. Whether you’re managing operational risks, driving efficiency, or preventing losses, understanding how to use both types of metrics effectively is crucial for success in today’s fast-paced business world.
What Are Leading and Lagging Indicators?
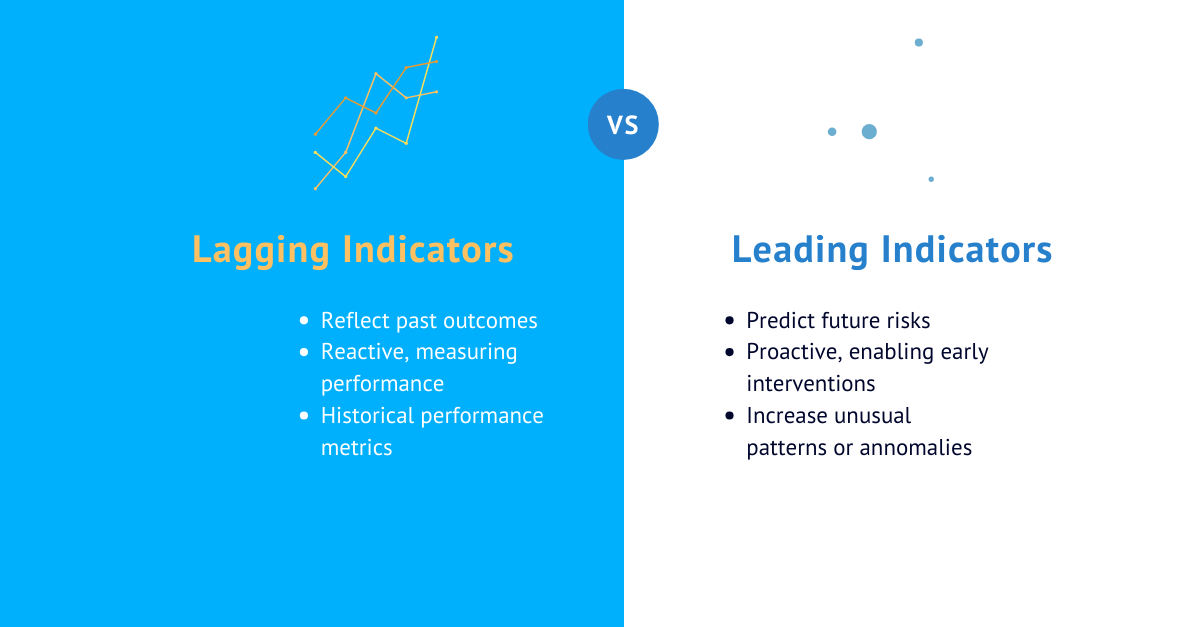
Leading Indicators
These metrics are forward-looking and signal potential outcomes. They provide an opportunity to take action before issues escalate.
Example: A sudden increase in refund claims in e-commerce may predict potential fraud, allowing teams to investigate and act before financial losses occur.
Lagging Indicators
These metrics are backward-looking, reflecting past outcomes and performance. While valuable for validation, they don’t allow for proactive intervention.
Example: Quarterly financial losses due to fraud highlight the effectiveness (or lack thereof) of implemented controls.
The Role of Indicators in Predictive Analytics
In my current role leading a team focused on data analytics, these two types of indicators play distinct yet complementary roles:
- Leading indicators help us identify risks early and develop proactive solutions. For instance, monitoring unusual delivery patterns can flag potential fraud risks before they escalate.
- Lagging indicators allow us to measure success and refine strategies. For example, analyzing quarterly theft rates helps evaluate the impact of preventive measures.
Balancing these metrics ensures that we’re not just responding to problems but actively preventing them.
Key Differences Between Leading and Lagging Indicators
| Feature | Leading Indicators | Lagging Indicators |
|---|---|---|
| Focus | Forward-looking | Backward-looking |
| Purpose | Preventive and proactive | Evaluative and reflective |
| Example | Monitoring refund claims to predict fraud | Total fraud-related losses for a quarter |
| Actionable | Yes, enables early intervention | No, provides validation after the fact |
Examples from My Experience
Risk Analytics in Logistics
- Leading: A spike in unscanned inventory during the shipping process often indicates a growing operational issue that needs immediate attention.
- Lagging: The quarterly total of lost shipments shows the outcome of unaddressed problems and helps us refine processes.
Fraud Detection
- Leading: Patterns of refund claims with no product return can highlight emerging fraud schemes early.
- Lagging: Total fraud-related financial losses in the previous month allow us to validate the impact of our controls.
Operational Efficiency
- Leading: Monitoring on-time delivery rates weekly signals potential risks to customer satisfaction.
- Lagging: End-of-quarter customer feedback and satisfaction scores confirm whether we met our operational targets.
How to Choose and Use Metrics
-
Align Metrics with Goals
Define whether your objective is to act proactively or measure outcomes. -
Balance Both Types of Indicators
Leading indicators drive real-time decision-making, while lagging indicators validate and refine your strategies. -
Integrate Metrics into Dashboards
Visualizing both types of indicators in real-time dashboards enables teams to act quickly on leading metrics while analyzing historical data for trends.
Best Practices for Using Leading and Lagging Indicators
- Focus on Relevance: Ensure indicators are directly tied to strategic objectives.
- Update Regularly: As risks evolve, refresh your metrics to remain aligned with current priorities.
- Involve Teams: Collaborate across functions to ensure all stakeholders understand and leverage these indicators effectively.
Conclusion
Whether you’re running predictive models, optimizing operations, or managing risks, balancing leading and lagging indicators is key to success. Leading indicators enable proactive decision-making, while lagging indicators provide validation and insights for improvement.
In my experience, this balance is what allows teams to stay ahead of challenges, adapt quickly, and continuously improve. Are you tracking the right metrics to drive your strategy forward? Share your thoughts or examples in the comments—I’d love to hear how you’re balancing your indicators!